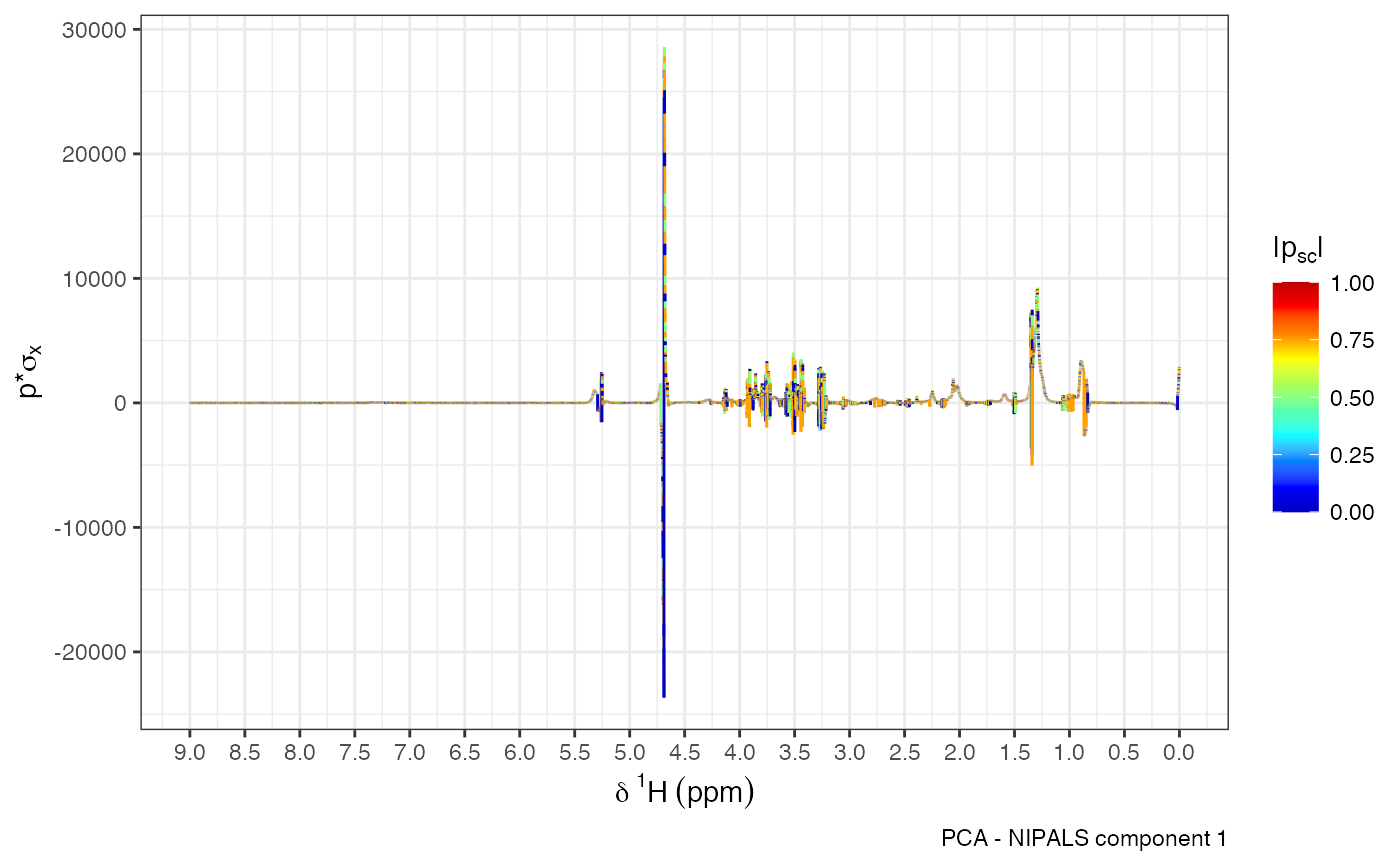
Overlay PCA or OPLS loadings on the ppm axis for NMR data. Visualizations can be based on statistical reconstruction or backscaling, providing insights into spectral regions that contribute most to variation or separation.
Usage
plotload(
  mod,
  shift = c(0, 10),
  pc = 1,
  type = "Backscaled",
  title = NULL,
  r_scale = FALSE
)
Arguments
- mod
A PCA or OPLS model object generated via the metabom8 package.
- shift
Numeric vector of length 2. Chemical shift (ppm) range to display.
- pc
Integer. Index of component to visualize (use 1 for OPLS).
- type
Character. Either
"Statistical reconstruction"or"Backscaled"(case-insensitive).- title
Optional plot title.
- r_scale
Logical. If
TRUE, correlation color gradient is fixed between 0 and 1 (only for statistical reconstruction).