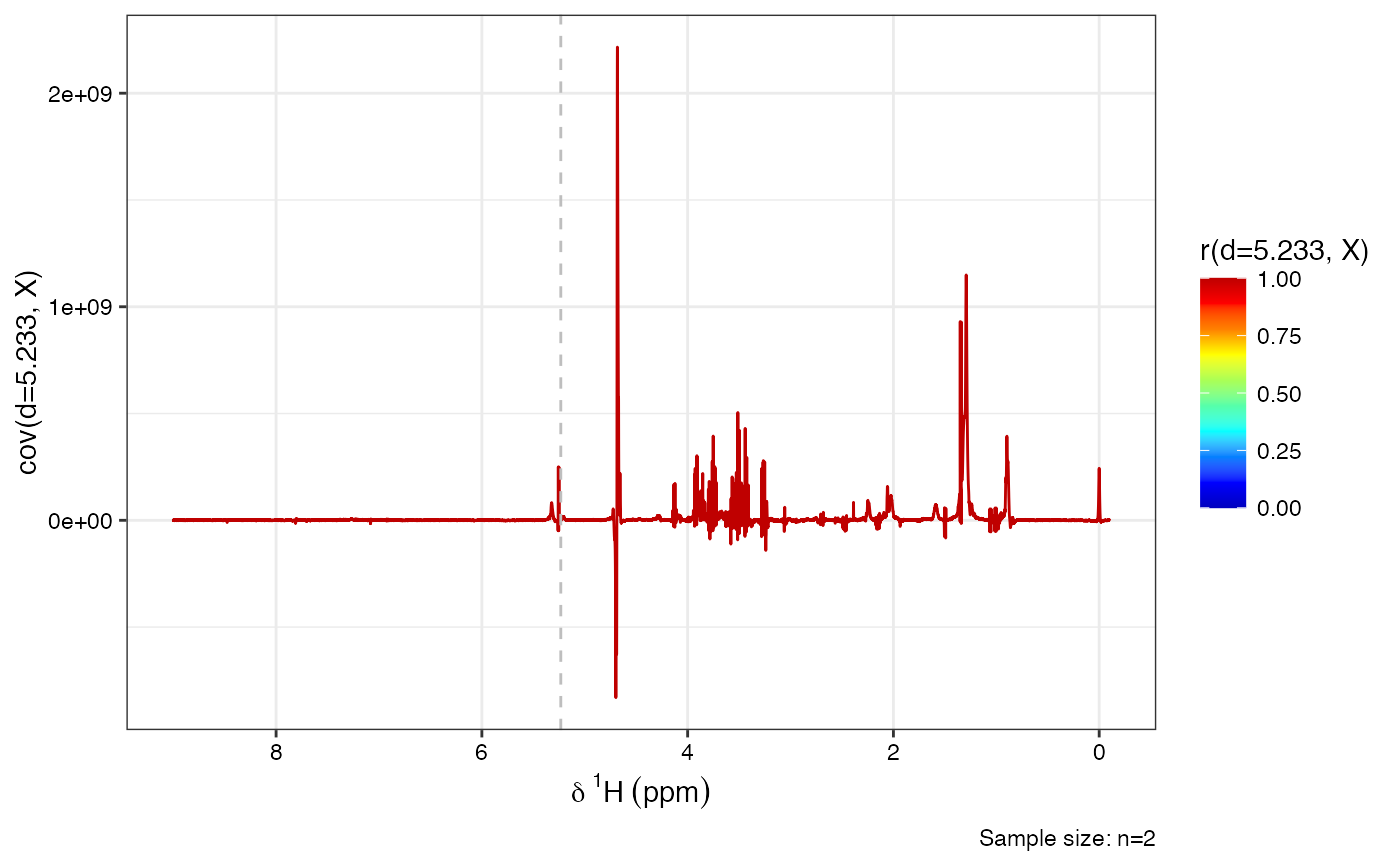
Performs STOCSY analysis on 1D NMR spectra. The function calculates correlation and covariance of all variables in X against a given driver variable (either a ppm value or external vector).
Arguments
- X
Numeric matrix or data frame where rows are spectra and columns are chemical shift variables.
- ppm
Numeric vector of chemical shift values corresponding to columns in
X.- driver
Numeric scalar or vector. A ppm value (for internal STOCSY) or external numeric vector of same length as number of rows in
X.- plotting
Logical. If TRUE, display a STOCSY plot.
- title
Character string for the plot title.
Value
An S4 object of class stocsy1d_metabom8 containing correlation, covariance, driver, and metadata.
Examples
data(covid)
X <- covid$X
ppm <- covid$ppm

stcy_glucose <- stocsy(X, ppm, driver = 5.233)

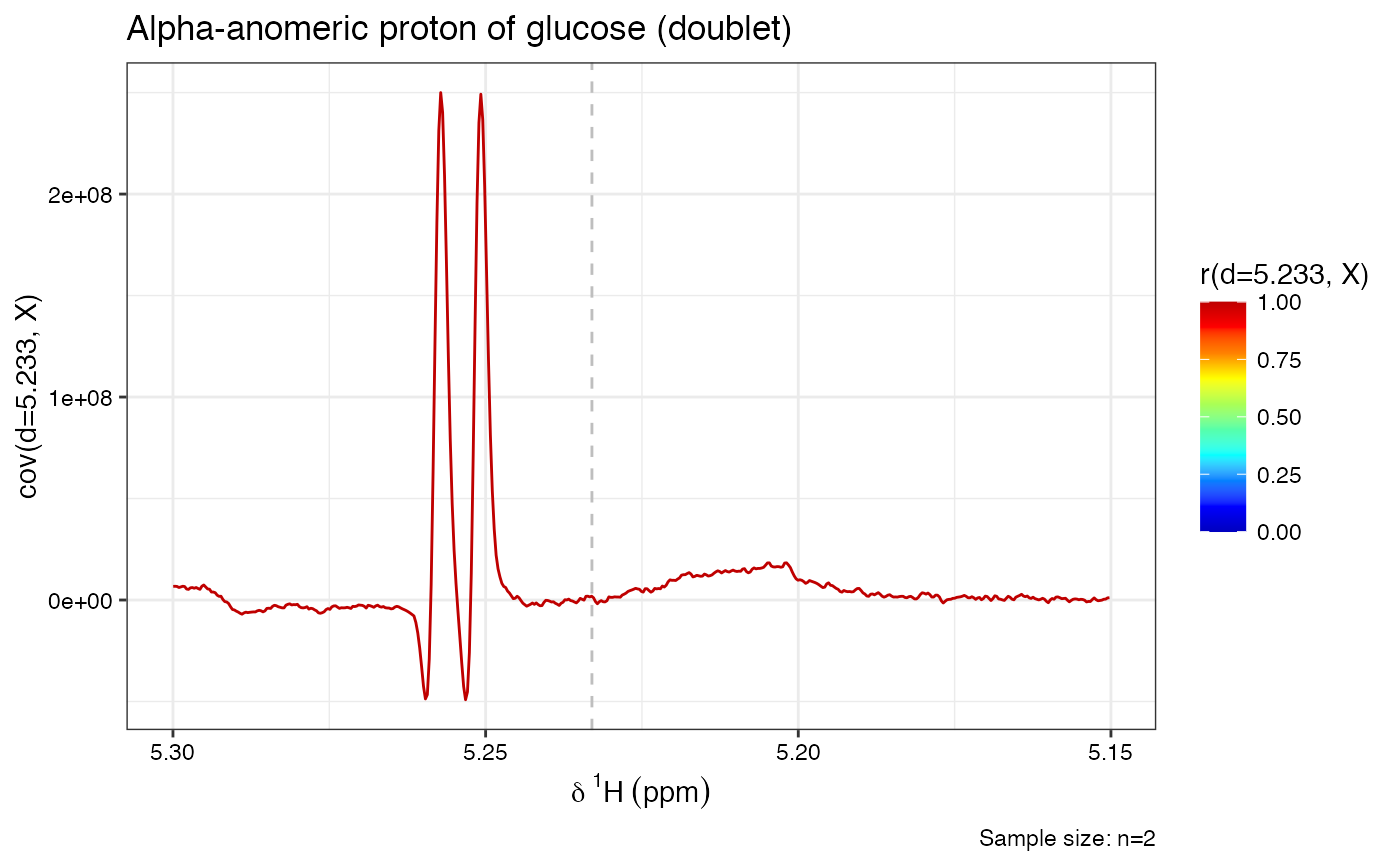
plotStocsy(stcy_glucose, shift = c(5.15, 5.30), title = "Alpha-anomeric proton of glucose (doublet)")
