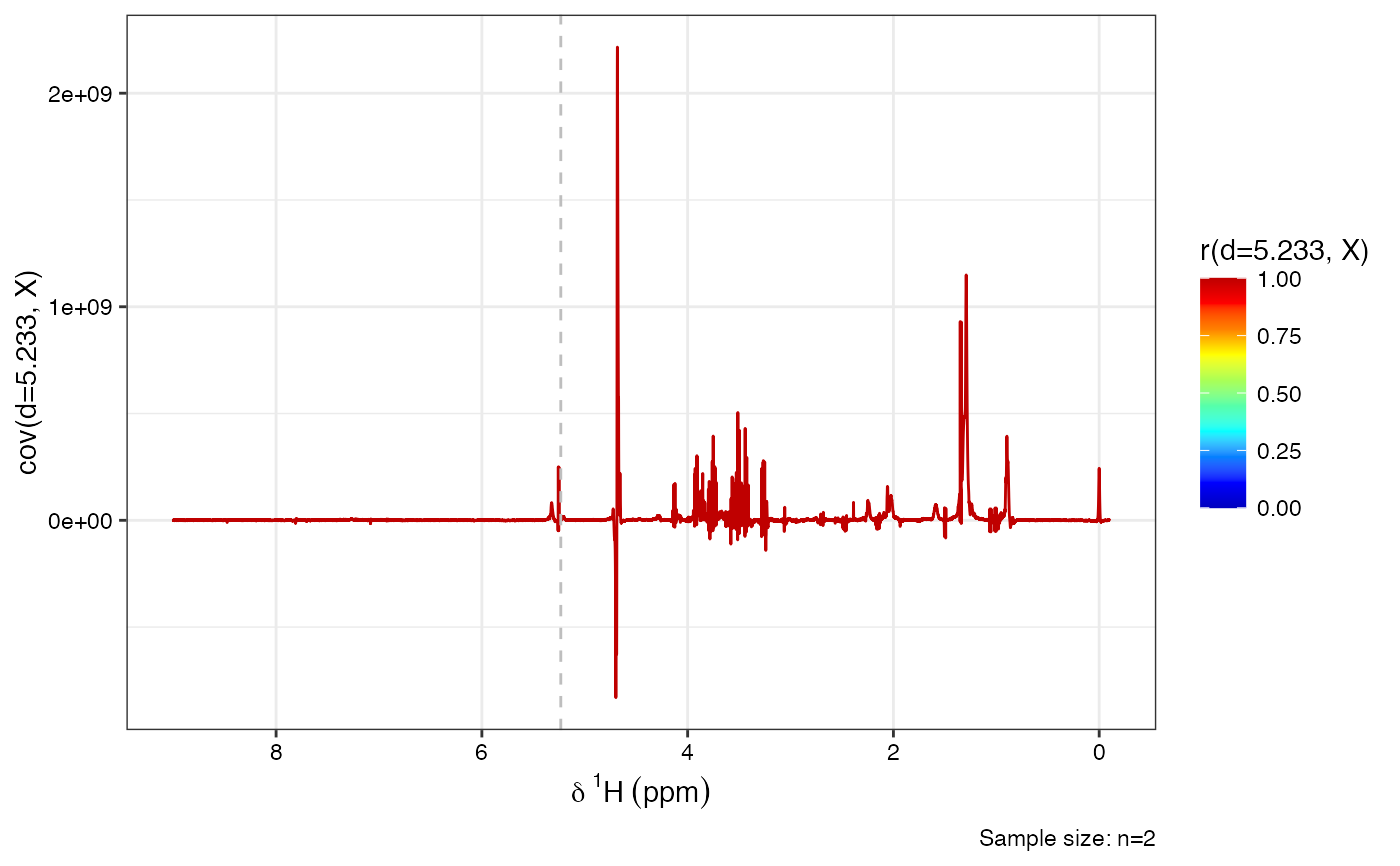
Generates a STOCSY plot (covariance trace coloured by absolute correlation).
Usage
plotStocsy(stoc_mod, shift = c(0, 10), title = NULL)Arguments
- stoc_mod
An object of class
m8_stocsy1dreturned bystocsy().- shift
Numeric vector of length 2 specifying the chemical shift range (ppm).
- title
Optional character plot title.