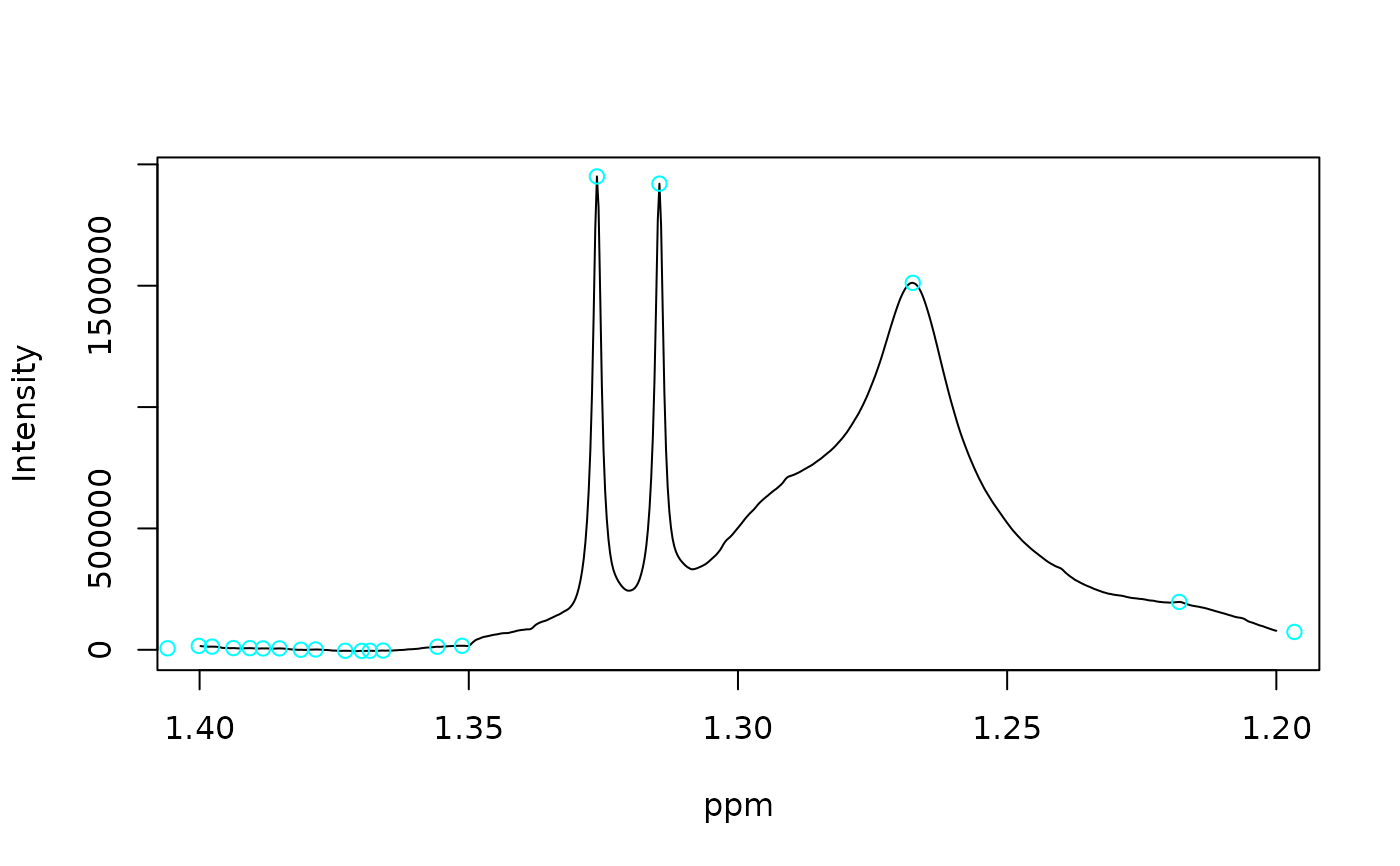
Identifies local maxima, minima, or both from smoothed NMR spectra using Savitzky–Golay filtering.
Arguments
- X
Numeric matrix. NMR data with spectra in rows and chemical shifts in columns.
- ppm
Numeric vector. Chemical shift values corresponding to columns in
X.- fil_p
Integer. Polynomial order of the Savitzky–Golay filter.
- fil_n
Integer. Filter length (must be odd) of the Savitzky–Golay filter.
- type
Character. Type of extrema to return:
"max","min", or"both".
Value
A list of data frames, one per spectrum. Each data frame contains:
idc: Index of the detected peak.ppm: Chemical shift at the peak.Int: Intensity at the peak.Etype: Extrema type:1for minima,-1for maxima.
Details
The spectra are smoothed using a Savitzky–Golay filter to reduce noise. Extrema are then detected by identifying sign changes in the first derivative of the smoothed signal.