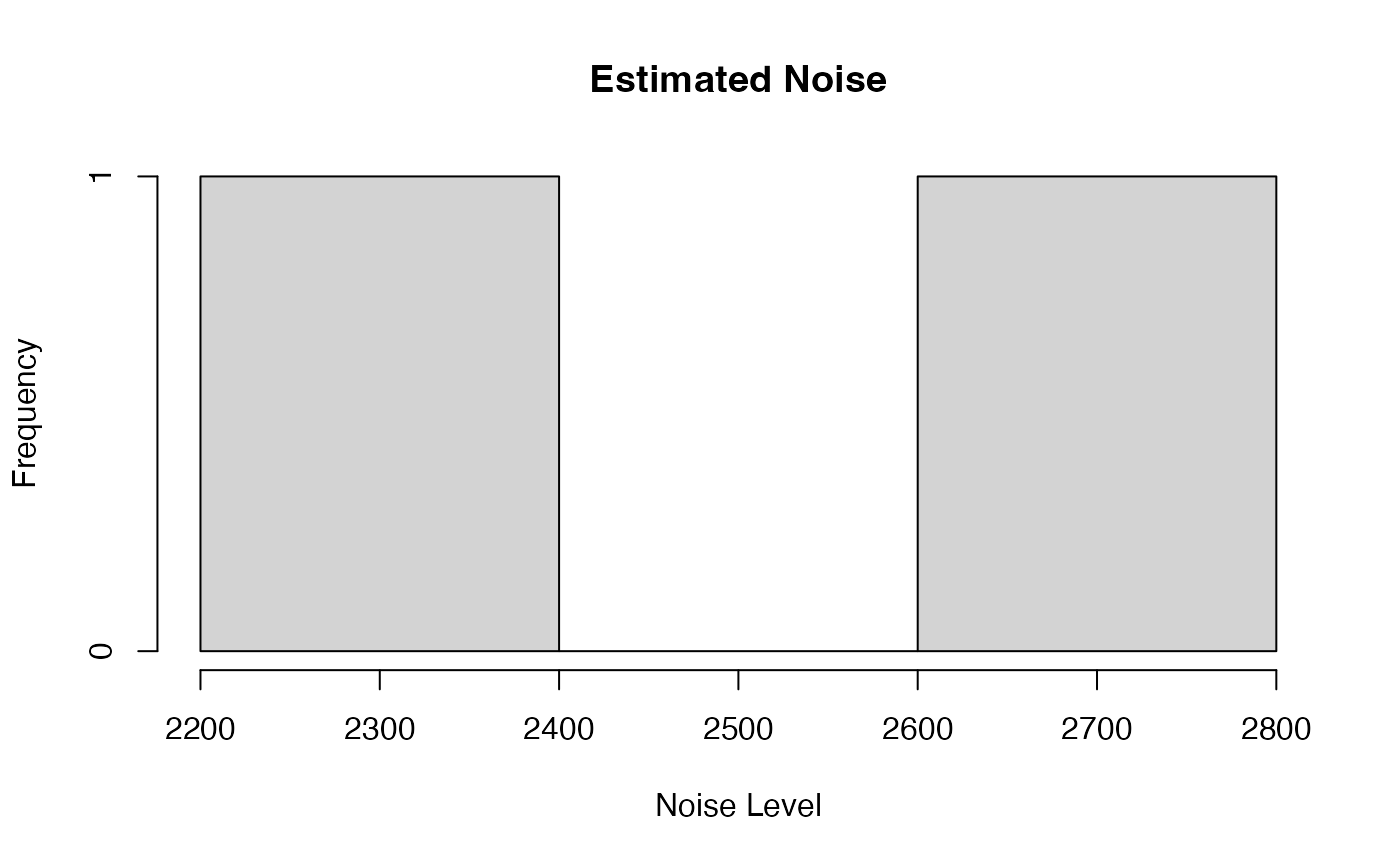
Estimates the noise level for each spectrum in a 1D NMR dataset by analyzing a signal-free region. Useful for quality control (QC) before or after spectral processing such as normalization or baseline correction.
Usage
noise.est(X, ppm, where = c(14.6, 14.7))Arguments
- X
Numeric matrix. NMR data with spectra represented in rows (samples x chemical shift bins).
- ppm
Numeric vector. Chemical shift positions in ppm. Must match the number of columns in
X.- where
Numeric vector of length 2. Specifies the ppm range to use for noise estimation. This range should be free of peaks (i.e., no expected metabolite signal). Default is
c(14.6, 14.7).
Details
Noise is estimated after baseline correction using asymmetric least squares smoothing
(via asysm). The output is based on the 95th percentile of the signal in the specified
region and assumes a minimum of 50 points in that region. If fewer points are available, the function stops.
Note
Choose the where region carefully based on acquisition setup.
Signal-free regions are typically at the high or low ppm ends (e.g., >10 ppm or <0 ppm).
See also
Other NMR:
alignSegment(),
binning(),
cvanova(),
get_idx(),
lw(),
matspec(),
normErectic(),
read1d(),
read1d_raw(),
stocsy1d_metabom8-class,
storm()
