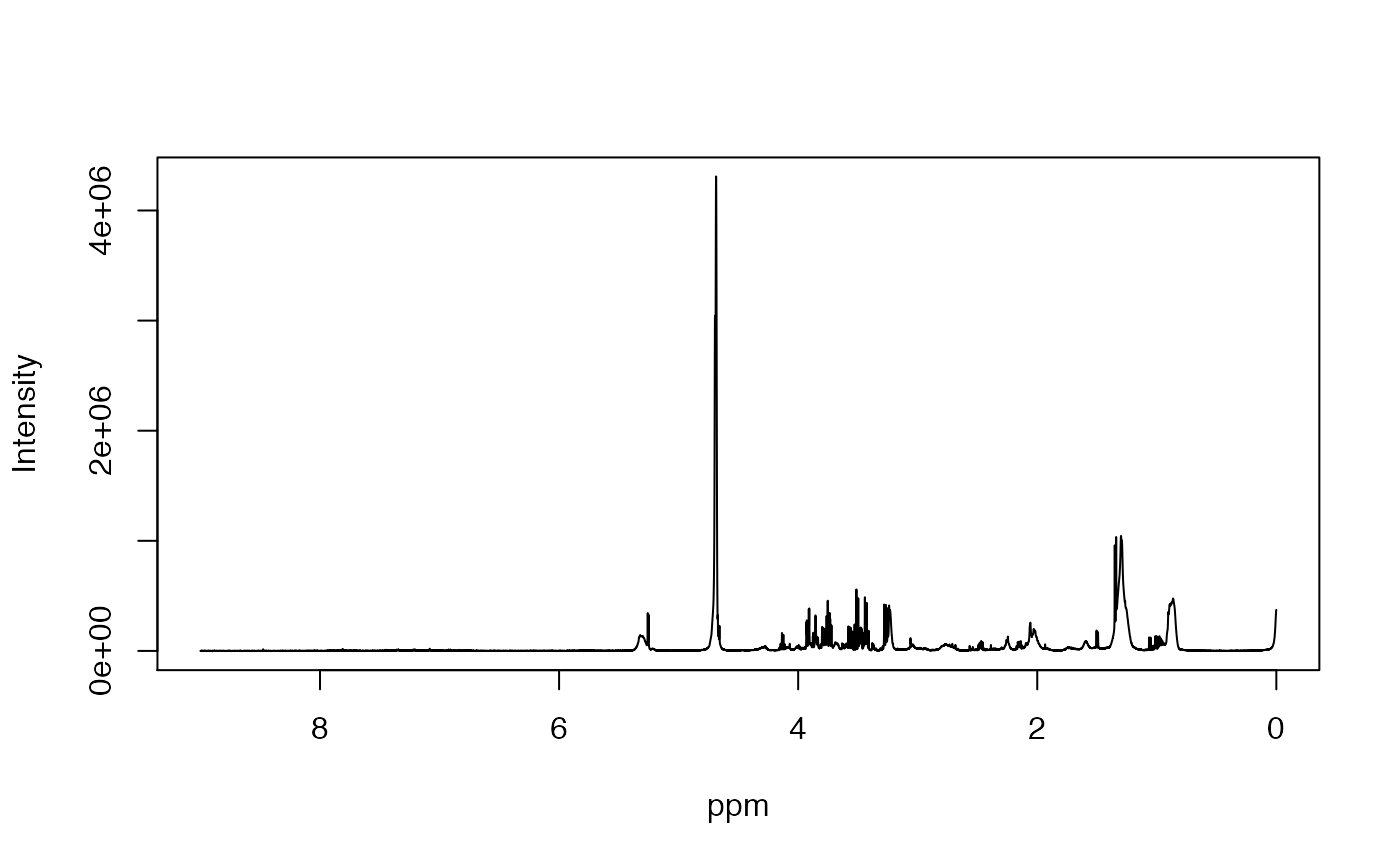
Plots a 1D NMR spectrum using either base R or interactive Plotly graphics.
Usage
spec(
  x,
  ppm,
  shift = c(0, 11),
  interactive = TRUE,
  name = "A",
  mode = "lines",
  base = FALSE,
  add = FALSE,
  ...
)
Arguments
- x
Numeric vector. NMR spectrum intensity values.
- ppm
Numeric vector. Chemical shift positions.
- shift
Numeric length-2 vector. Chemical shift range to plot (e.g.,
c(0, 11)).- interactive
Logical. Use plotly for interactive output? Defaults to TRUE.
- name
Character. Label for trace (Plotly only).
- mode
Character. Plotly trace mode: 'lines', 'markers', or 'lines+markers'.
- base
Logical. If TRUE, use base R plot (overrides
interactive).- add
Logical. If TRUE, add to an existing base R plot.
- ...
Examples
data(covid)
X <- covid$X
ppm <- covid$ppm
p <- spec(X[1, ], ppm, shift = c(0, 11), interactive = TRUE)
if (interactive()) p

spec(X[2, ], ppm, shift = c(0, 11), interactive = FALSE)
spec(X[3, ], ppm, shift = c(0, 11), interactive = FALSE, add = TRUE, col = 'red')
