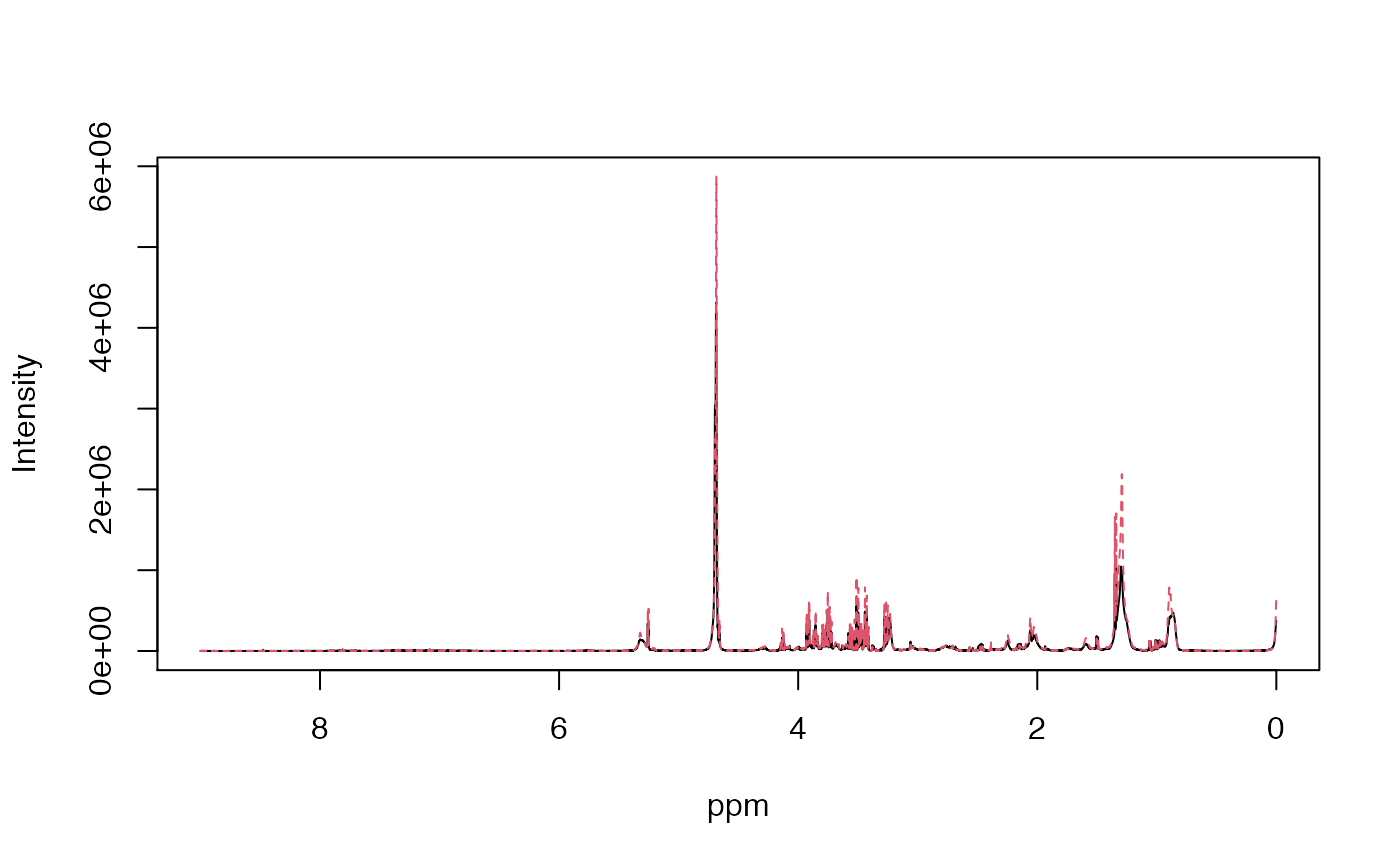
Plots multiple 1D NMR spectra using either base R or interactive Plotly graphics.
Usage
matspec(X, ppm, shift = c(0, 9.5), interactive = TRUE, ...)Arguments
- X
Numeric matrix. NMR data matrix with spectra in rows.
- ppm
Numeric vector. Chemical shift axis (must match
ncol(X)).- shift
Numeric vector of length 2. Chemical shift window to plot (e.g.,
c(0, 9.5)).- interactive
Logical. Use plotly for interactive plotting (default:
TRUE).- ...
Additional arguments passed to
matplot()for non-interactive plots.
See also
Other NMR:
alignSegment(),
binning(),
cvanova(),
get_idx(),
lw(),
noise.est(),
normErectic(),
read1d(),
read1d_raw(),
stocsy1d_metabom8-class,
storm()
Examples
data(covid)
X <- covid$X
ppm <- covid$ppm
matspec(X[1:3,], ppm, interactive = TRUE)
matspec(X[1:3,], ppm, interactive = FALSE)