Returns the indices of the chemical shift vector (ppm) that fall
within the specified range.
Usage
get_idx(range = c(1, 5), ppm)

get.idx(range = c(1, 5), ppm)
Arguments
- range
Numeric vector of length 2 specifying lower and upper bounds
(order does not matter).
- ppm
Numeric vector. The full chemical shift axis (in ppm).
Value
Integer vector of indices corresponding to ppm values within the given range.
Examples
data(covid_raw)
X <- covid_raw$X
ppm <- covid_raw$ppm
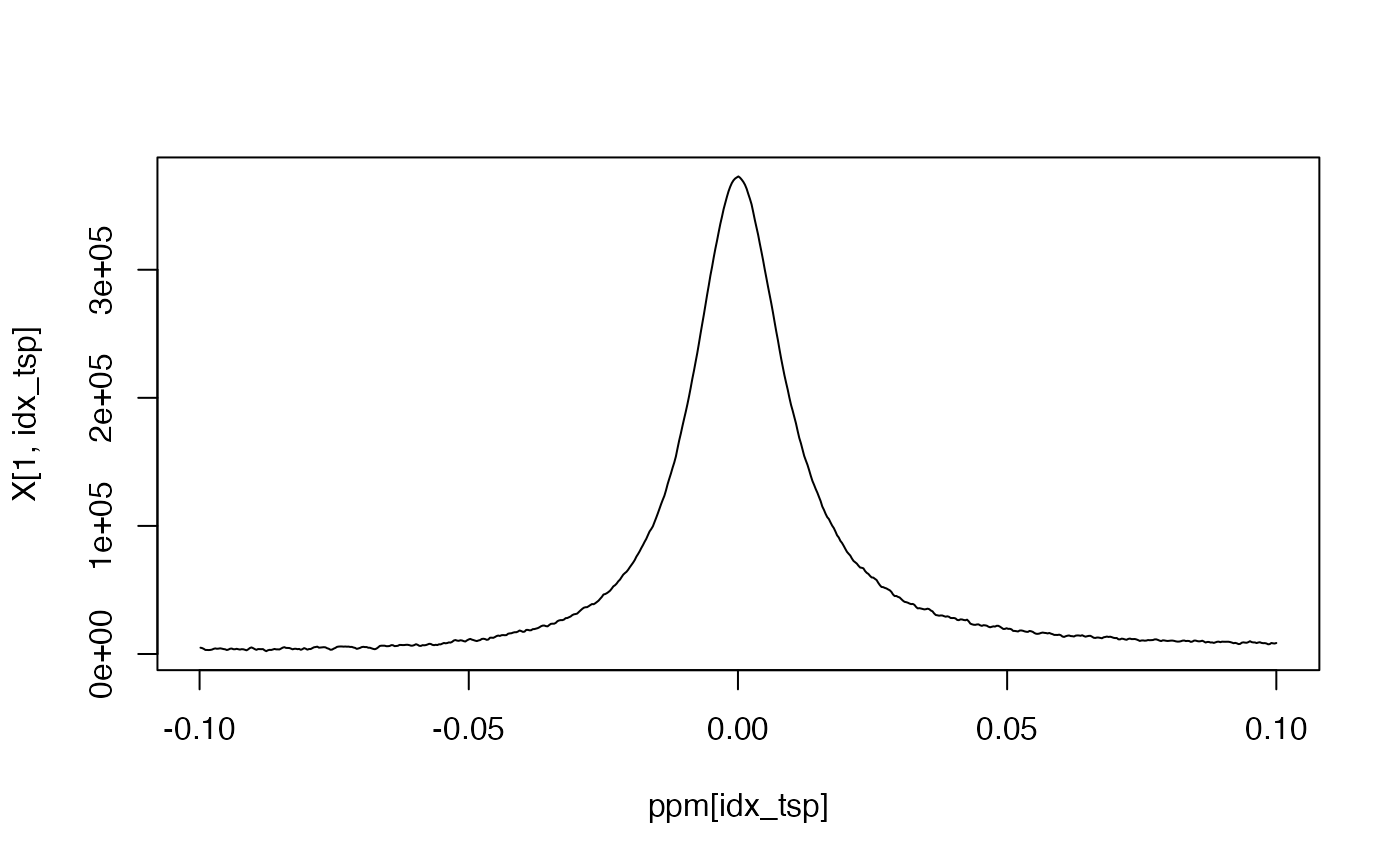
idx_tsp <- get_idx(c(-0.1, 0.1), ppm)
ppm[range(idx_tsp)]
#> [1] 0.09999952 -0.09983441
plot(ppm[idx_tsp], X[1, idx_tsp], type = 'l')