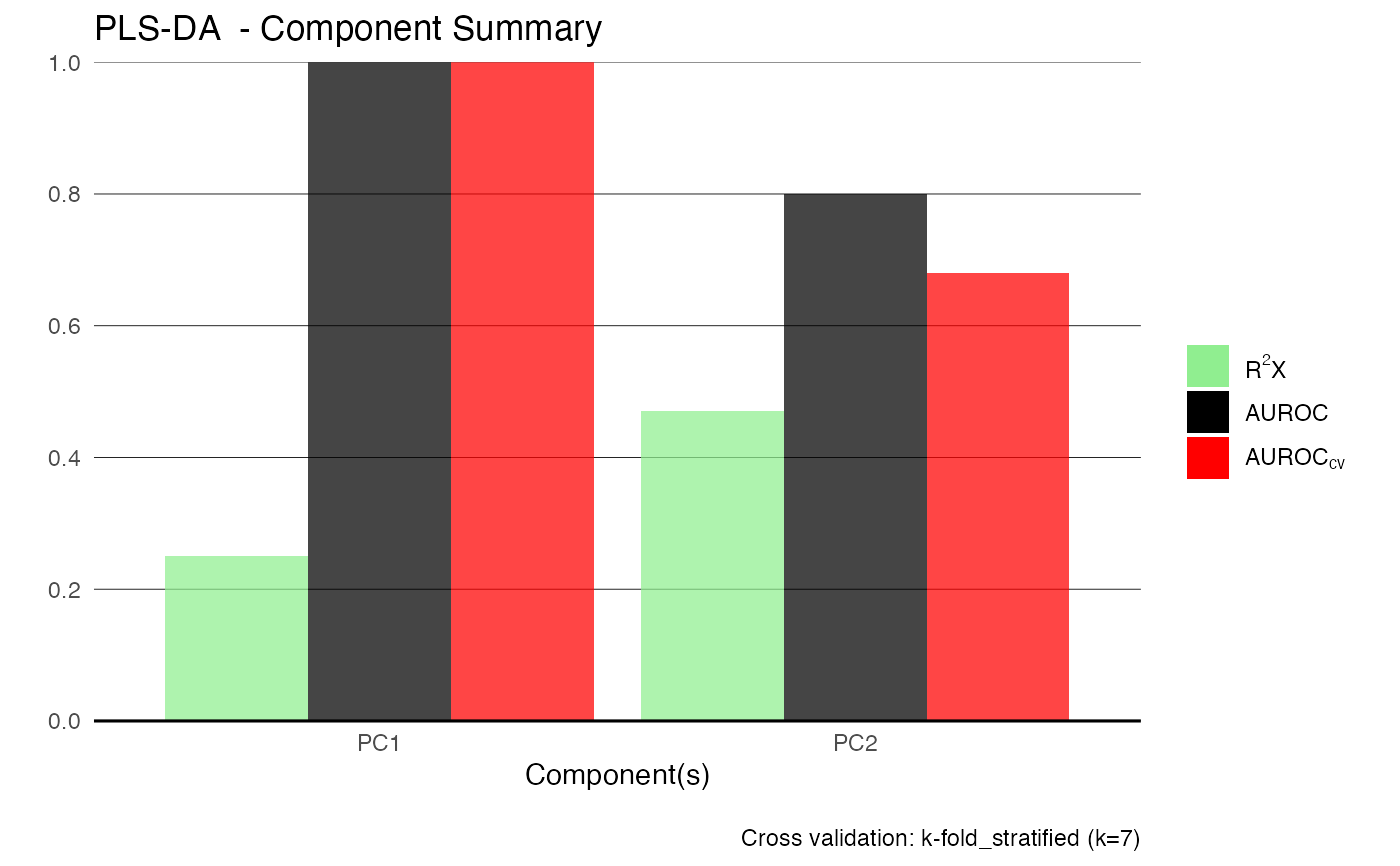
Fit a Partial Least Squares (PLS) model for regression (R) or discriminant analysis (DA), with automated cross-validated component selection.
Usage
pls(
  X,
  Y,
  center = TRUE,
  scale = "UV",
  cv = list(method = "k-fold_stratified", k = 7, split = 2/3),
  maxPCo = 5,
  plotting = TRUE
)
Arguments
- X
A numeric matrix or data frame. Each row represents an observation, and each column a metabolic variable.
- Y
Response vector or matrix. Must match the number of rows in
X.- center
Logical. Should data be mean-centered? Default is
TRUE.- scale
Character. Scaling method:
"None","UV"(unit variance), or"Pareto".- cv
Named list specifying cross-validation settings:
methodCross-validation type:
"k-fold","k-fold_stratified","MC", or"MC_balanced".splitFraction of observations used for training (used in Monte Carlo CV).
kNumber of folds or repetitions.
- maxPCo
Integer. Maximum number of orthogonal components to test.
- plotting
Logical. If
TRUE, model summary (e.g. R2X, Q2, AUROC) is plotted. Default isTRUE.
Value
An object of class PLS_metabom8, an S4 class with scores, loadings, predictions, and validation statistics.
Details
Cross-validation is used to select the optimal number of predictive components based on Q2 or AUROC. The method supports both regression and classification with binary or multi-class responses. Model interpretability is often best with pairwise class comparisons.
References
Geladi, P. & Kowalski, B.R. (1986). Partial least squares regression: a tutorial. Analytica Chimica Acta, 185, 1–17.
Examples
data(covid)
X <- covid$X
an <- covid$an

model <- pls(X, Y = an$type)
#> Performing discriminant analysis.
#> Reducing k to 5 due to small group size (min n = 5).

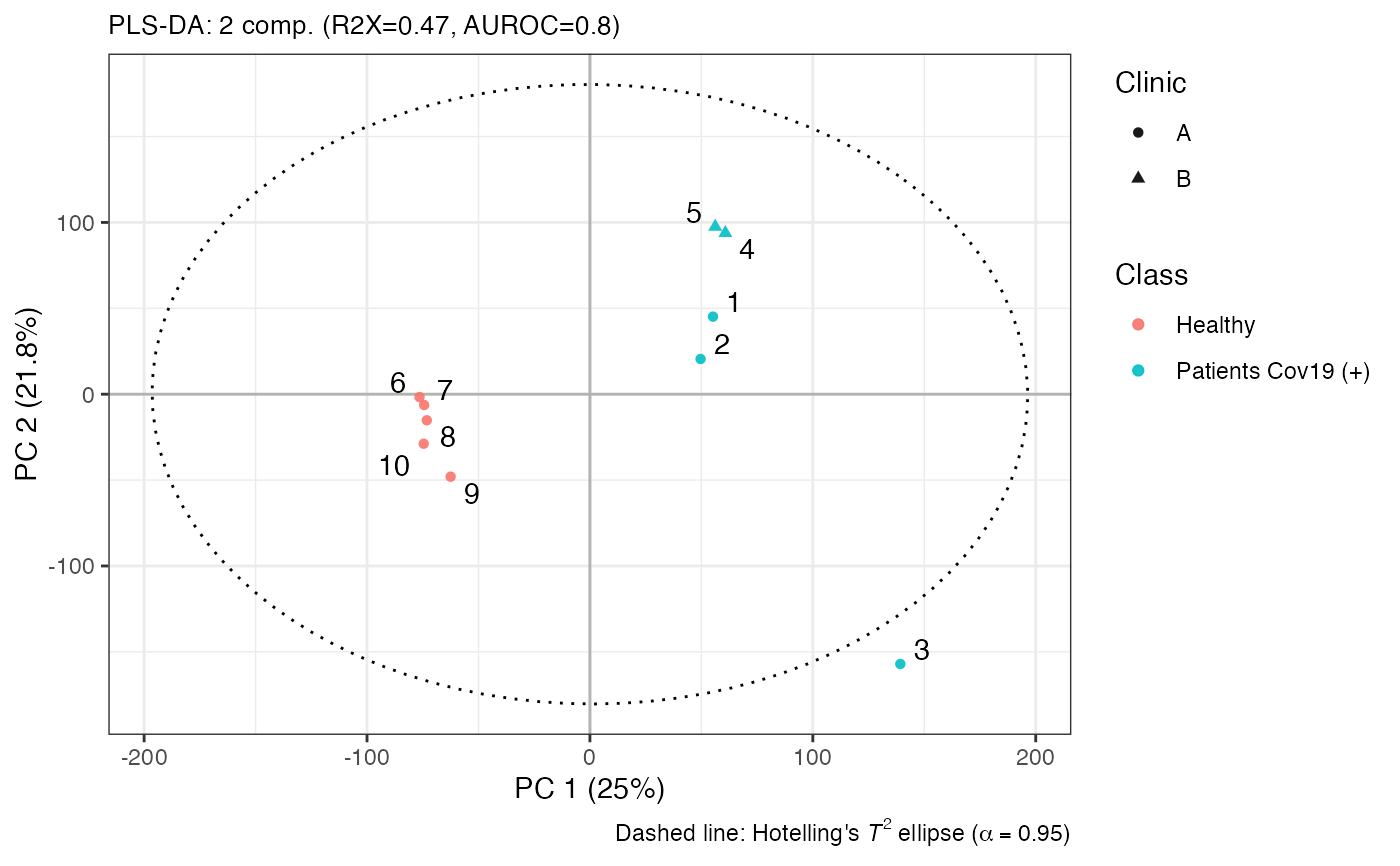
plotscores(model, an = list(Class = an$type, Clinic = an$hospital, id = 1:nrow(an)), pc = c(1, 2))
