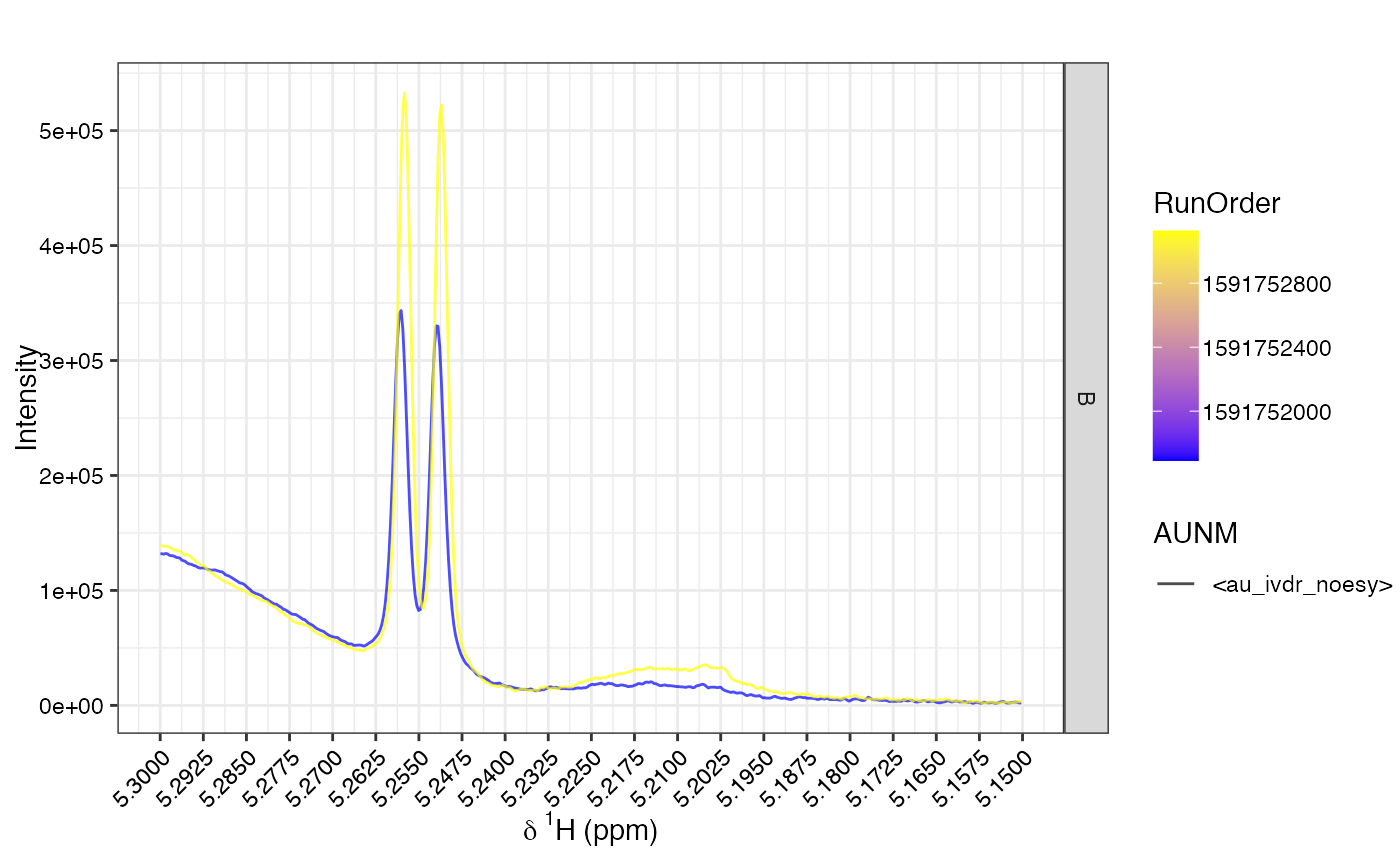
Overlay multiple NMR spectra in a specified chemical shift region using ggplot2.
Faceting, coloring, and line types can be controlled via an annotation list. Useful
for QC and visual inspection of subsets or trends in spectral data.
Arguments
- X
Numeric matrix. NMR data with spectra in rows.
- ppm
Numeric vector. Chemical shift values corresponding to columns of
X.- shift
Numeric vector of length 2. Region in ppm to plot (recommended to be small for performance).
- an
Named list of 1–3 elements for grouping: 1st for facetting, 2nd for color, 3rd for line type.
- alp
Numeric. Alpha transparency of lines (0 to 1).
- size
Numeric. Line width (e.g., 0.5).
- title
Character. Plot title.
- ...
Additional arguments passed to
facet_grid.