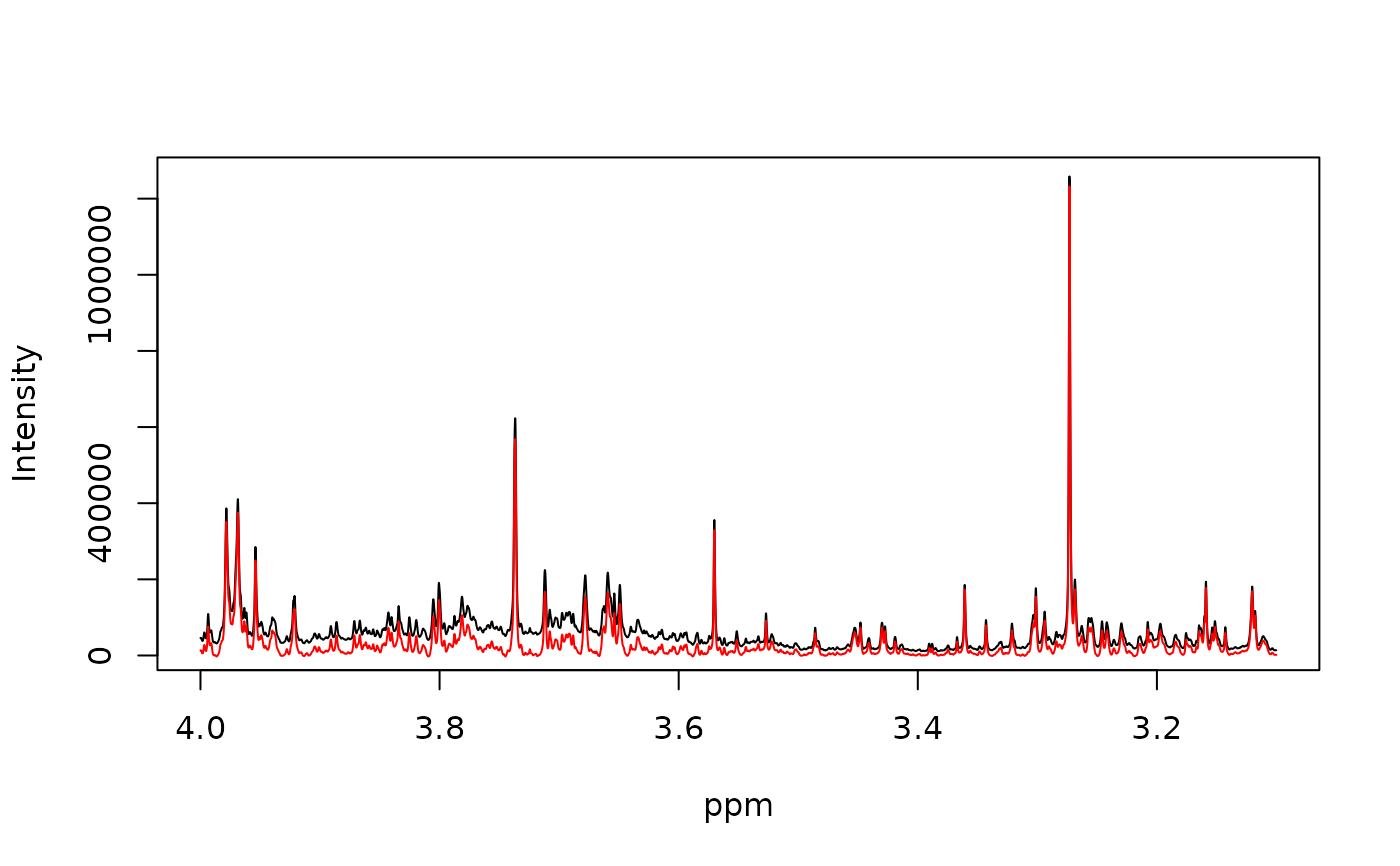
Applies baseline correction to each spectrum (row) of a spectral matrix.
Multiple correction algorithms are available and selected via the
method argument.
Usage
correct_baseline(X, method = c("asls", "linear"), ...)

bline(X, ...)
Arguments
- X
Numeric matrix or metabom8
datobject containing spectra in rows and spectral variables in columns.- method
Character specifying the baseline correction algorithm. One of:
"asls"Asymmetric least squares baseline estimation.
"linear"Linear baseline estimated from edge regions.
- ...
Additional parameters passed to the selected method.
Arguments for
method = "asls"- lambda
Numeric smoothing parameter controlling baseline stiffness. Larger values produce smoother baselines. Default
1e7.- iter_max
Maximum number of iterations used in the baseline estimation procedure. Default
30.
Arguments for
method = "linear"- ppm
Numeric vector describing the spectral axis (e.g. chemical shift). Must have length equal to
ncol(X).- edge_frac
Fraction of points at each spectrum edge used to estimate the baseline. Default
0.1.
Value
Numeric matrix containing baseline-corrected spectra with the
same dimensions as X. If X is a metabom8 dat object, the corrected
matrix replaces the X component while preserving associated metadata.
Details
Baseline correction is performed independently for each spectrum.
The "asls" method estimates a smooth baseline using asymmetric least
squares smoothing, which is well suited for spectra with positive peaks
such as NMR metabolomics data.
The "linear" method estimates a straight baseline from the edges of
each spectrum and subtracts the fitted trend.
The returned object includes a .stamp attribute recording the
baseline correction method and parameters used.
References
Eilers PHC, Boelens HFM (2005). Baseline correction with asymmetric least squares smoothing.
See also
Other preprocessing:
align_segment(),
align_spectra(),
binning(),
calibrate(),
correct_lw(),
pqn(),
print_preprocessing()